Data
Make complex things understandable.
Data visualization, interactive maps, dashboards, analytics interfaces and data-driven storytelling.
- Interactive visualization
- Geospatial & mapping systems
- Dashboards & reporting
- Information design
Decisions should never rely on guesswork.
Modern tools allow deep analysis of user behavior, competitor performance, and search trends. At Oryan, we use advanced analytics to identify growth opportunities, monitor keyword performance, track user engagement, improve conversion rates, and adjust strategies in real time.

Complexity, made legible.
Every tap, search and visit leaves a trace. We turn those traces into maps, dashboards and stories people can read at a glance, and act on.
Things we've built
Data people can explore.
- Data visualization
- Interactive maps
- Platforms & portals
- Internal software
-
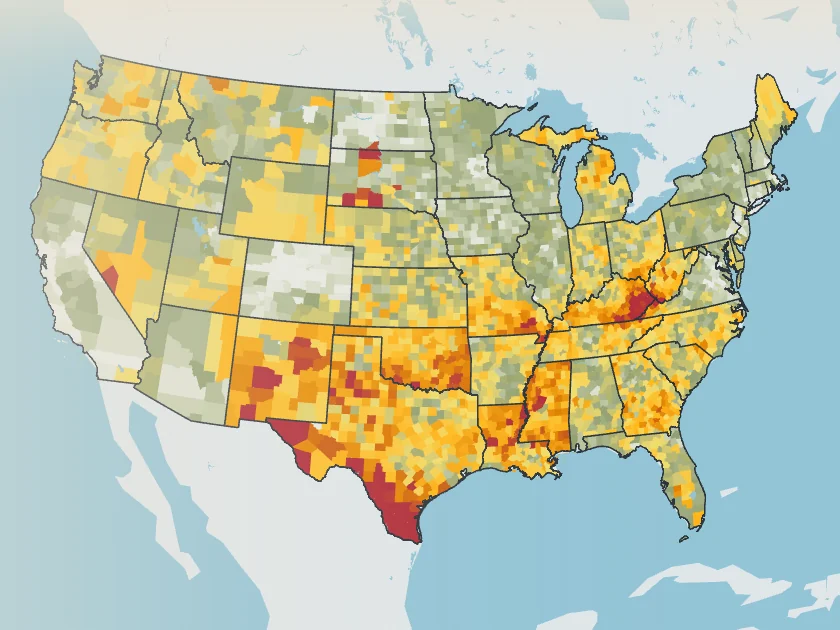
U.S. Hunger
A prototype built for Feeding America: food insecurity for every county in the country, on an explorable 3D map with a scroll-driven story behind it.
Explore the prototype (opens in a new tab) -
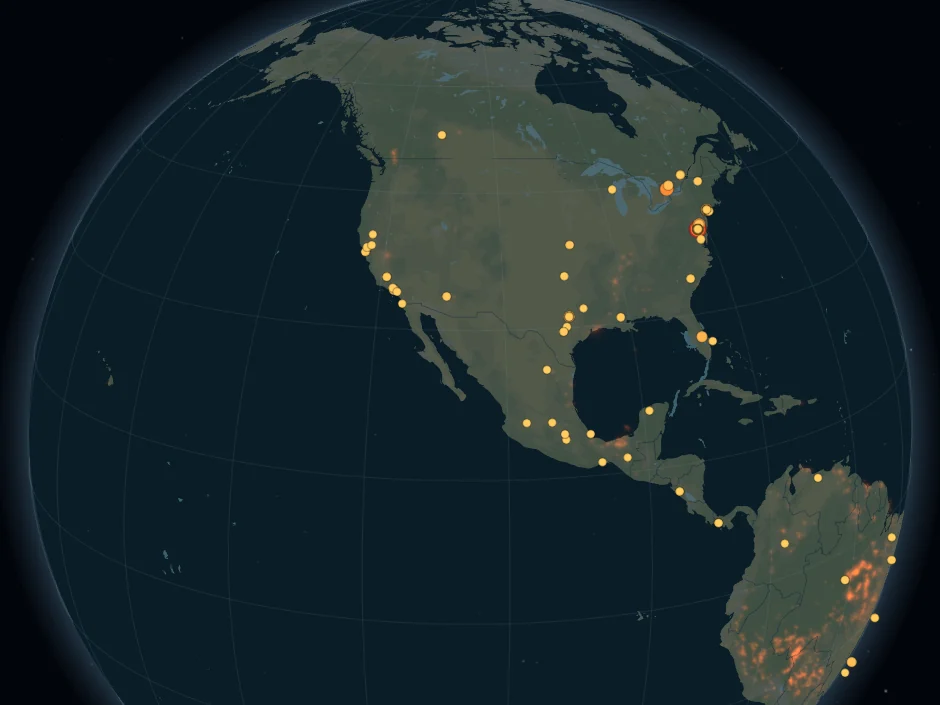
Bluedot
A live 3D globe of the last 24 hours of world news. Spin it, zoom in and open any country for its latest stories and the facts behind the place.
Spin the globe (opens in a new tab)
Campaigns & reporting
Detailed insight into the metrics that matter.
We build and run search and social advertising campaigns, on Google Ads, Facebook, Instagram and X, and report on them in the same place, so what you spend and what it returned sit side by side.
Our reports will help you measure the effectiveness of your ads, identify areas for improvement, and make data-driven decisions to optimize your advertising strategy. We provide detailed insights into key metrics.
Reach the right customers in the right location with our geolocation targeting services. Whether you're a local business or have a global reach, we can help you tailor your campaigns to specific geographic areas.
- Interactive maps
- Geocoding
- Dashboards
- Reporting
- Google Ads
- Social campaigns
- Conversion tracking
- Geolocation targeting
- Three.js
- WebGL
- Public data APIs
- SQLite
Tools we work in
- Google Analytics
- Google Ads
- Meta Ads
- X Ads
- Search Console
- Google Maps
- Three.js
What we make
- Interactive visualization
- Geospatial & mapping systems
- Dashboards & reporting
- Information design
Selected work
-
 Food Bank of Eastern MichiganCommunity
-
 Flint Farmers’ MarketMarkets & Retail
-
 Onit SciencesAgriculture
-
 Graham Health GroupHealthcare
-
 Mike Cox LawLaw Firm
-
 Facet InternationalGlobal Marketing
Data questions
What does a data project with Oryan look like?
Dashboards, interactive maps, reporting interfaces and data visualisation: the work of turning something complicated into something a person can act on. Recent examples include a national hunger map and a live operations dashboard.
Can you work with the systems and data we already have?
Usually, yes. Most of these projects start with data that is already being collected somewhere and is not being used, spread across a database, a spreadsheet export and somebody's reporting tool.
How do you decide what to put on a dashboard?
By starting from the decision, not the data. If a number does not change what somebody does on a Monday morning, it does not earn its place on the screen.
Do you build analytics that respect privacy law?
Yes. Measurement on the sites we build is consent-aware, and we will tell you plainly what is collected, how long it is kept and what your obligations are under GDPR and California law.
Dream. Build. Launch.
Turn your data into decisions.
Whether you're launching something new or refining what you already have, we help turn ideas into high-performing tools to help your business grow.